Data Diaries #7 - Farmland Bird Surveys in the Wolds
Data is at the core of what we do as a Local Environmental Records Centre. This series shines a light on the breadth and variety of the records we receive and how we deal with them.
Whilst our work with species data is often focused on the preparation and input of data to our reporting database, we are also involved in various projects and species recording initiatives where our experience with data collation, visualisation and analysis can support recorders in different ways.

Meadow Pipit, one of the species recorded in the surveys. Photo: Vaughan Grantham.
Earlier this year we received a large number of records from Derek Whiteley, an experienced recorder well-known to NEYEDC, part of a regular survey of birds from chalk farmland on the Yorkshire Wolds. The three survey years (2012, 2016, and 2019) produced approximately 1,300 records, mainly of farmland bird species with some additional records of butterflies and mammals. This included priority and protected species such as Barn Owl, Curlew, and Yellowhammer.
Another interesting aspect to this data was the inclusion of associated crop types (totalling over 30 single and combination crop types) with each record, linked to the tetrad within which the record of the farmland bird or other species was made. One of the aims of the surveys was to try and establish links between the presence of certain farmland bird species and certain crop types, which NEYEDC are hoping to help the recorder explore by aiding with the preparation, visualisation, and analysis of the data. Farmland birds have declined over the past 50 years against the backdrop of increased agricultural intensification and the use of pesticides and insecticides, which in turn target insect-feeding bird species.
Spread across three spreadsheets, one per survey year, the data comprised basic fields including species, date, grid reference, tetrad grid reference, crop type, and a field for additional information such as sex, life stage, and activity (breeding pair, singing etc.). The preparation for inclusion in our database was a simple process of transcribing information for key fields that make up a biological record (who, what, when, where) in addition to extra details such as activity and breeding information, before completing standard validation processes such as checking location and grid reference.
In addition to including these records in our database, we are also working alongside Keith to visualise, map, and analyse the data from these surveys. Long-term species recording projects undertaken in the same location and to the same methodology are extremely valuable datasets, as they allow for the extrapolation of patterns and inferences that would otherwise be caveated by many different factors.
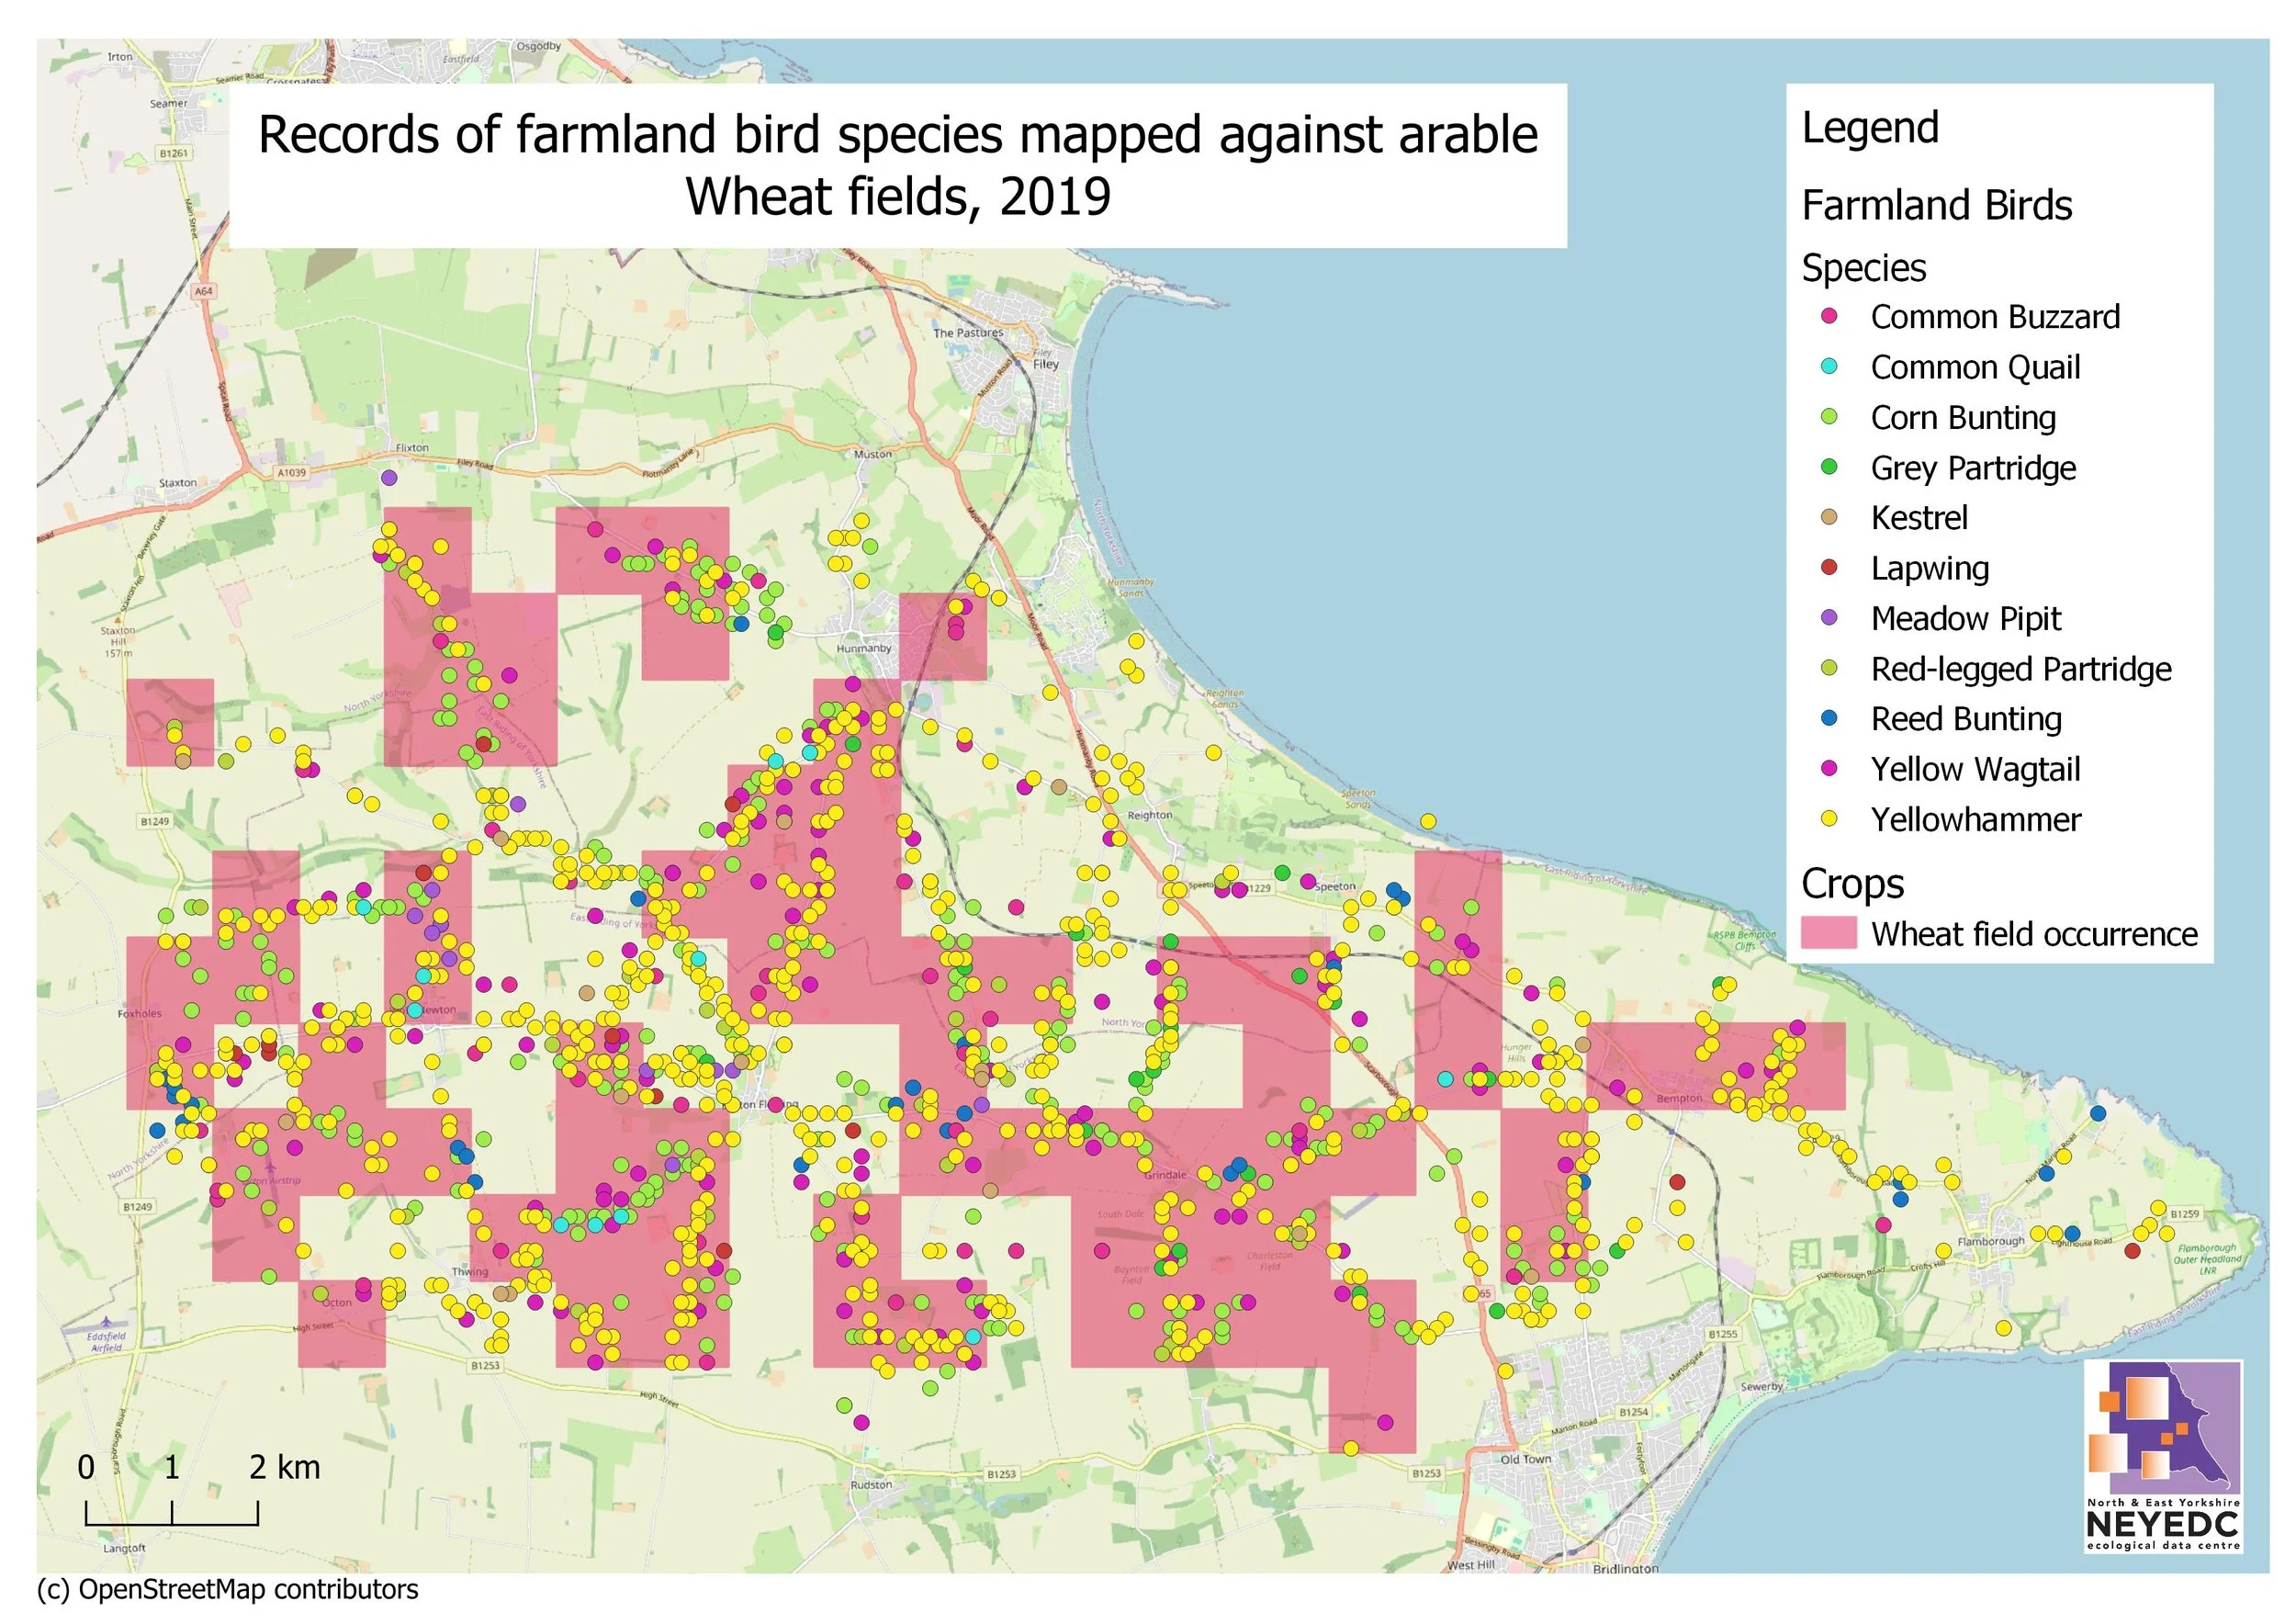
Static map showing the farmland bird species surveyed overlaid on monads showing occurrence of wheat fields.
As a first step to exploring the data, we took the 2019 dataset only to work on, with an aim to visualise both the species records and crop type tetrads together. Initially mapping was created in GIS which used points to represent species records, styled according to species, and the crop type tetrads included as a single layer and styled according to crop type. However, this resulted in a map that was difficult to interpret, as certain tetrads contained more than one crop type or crop combinations. Using tools in GIS, the tetrads were split into individual layers per crop type combination, resulting in 30+ different crop layers which could then be mapped individually.
However, for the purpose of viewing species records and crop types together, a large number of static maps would be both inefficient and inflexible. As an alternative approach, the data was brought into Mango Maps software, an accessible and user-friendly interactive mapping platform which allows users to view and explore maps, apply simple filters, and complete basic analysis, such as highlighting intersections of data that meets specific criteria. Layers can be added, grouped, and styled against simple background mapping and toggled on and off, without requiring the user to have any experience with the GIS interface. Whilst Mango Maps provided a platform that would be excellent for the easy sharing and inspection of the survey data, the large number of crop layers still posed an issue, making the final product difficult to navigate.
Outside of GIS and similar software, the programming language R is a powerful alternative option for working with data, specially designed with data visualisation in mind. In R, data can be ‘read in’ in table or shapefile format where a huge number of functions can be applied to produce mapping and analysis outputs with a high degree of personalisation. R also allows us to use code to show these outputs in different formats (PDF, word document, HTML webpage). One of these options is the use of a package called R Shiny. R Shiny allows a user to create interactive web applications from code in R, which is accessible using a simple link shared with users of the data.
Using R Shiny, we created a basic framework for a web app based around a leaflet map (another package in R for the creation of interactive maps) of the species and crop type mapping, with each crop type as its own layer and species records as points. These can be turned on and off as needed to display different combinations of data. The user interface itself is very flexible, with options to add side bars, tabs, and menus which will allow us to add multiple years of data and different map views.

A test version of the R Shiny app, showing the interactive map and menu on the left hand side, which can be added to with maps of different years, single-species maps etc.
We will continue to develop the app to display all years of survey data in a way that can be shared with the recorder and explore ways this can be analysed to make any inferences regarding this suite of species and their tendencies to associate with different crops. This is just one example of the ways in which we work more closely with data and recorders to support long-term recording projects in our area.